
GBPUSD found intermediate lows at 1.3140, losing close to 7 handles since its June 30 highs.
The pound had seen a huge uptrend in 2025, with a 13.57% increase from 1.21, as the year commenced, to its recent top at 1.3790.
July changed Forex markets consequently with the Dollar Index retaking some of what it had lost through the first half – After the injurious US Non-Farm Payrolls report from last Friday, the Greenback saw some of its momentary strength evaporate and which allowed the GBP to take a breather from strong selling flows.
The Bank of England began a non-continuous rate-cutting cycle, taking their benchmark rate from 5.25% to the current 4.25%.
The Central Bank has struggled with persistently high inflation, in both goods and services sectors, prompting a cautious dovish stance.
However, with the degrading global outlooks and some government mess-ups, Markets have priced a 96% chance of a 25 bps cut for the upcoming meeting.
There is still some uncertainty regarding how dovish the communications from the BoE will be, which will impact the outlook for the pair.
In the waiting for the Thursday meeting (decision released at 7:00 A.M. ET), let’s have a look at the Technicals for the pair.
GBPUSD Technical Analysis ahead of Thursday’s Bank of England Meeting
GBPUSD Daily Chart
GBPUSD Daily Chart, August 5, 2025 – Source: TradingView
As explained in the introduction, the strong selling flows that started on the 1st of July has found a local bottom on Friday, leading the pair to a 1,300 Pip recovery back right around the 1.33 handle.
It is notable that GBP/USD broke below its 2025 rising channel – It will be key to see how markets react after this. A Head and Shoulders pattern could also be developing.
The pair saw some technical support from an oversold daily RSI, with the indicator currently still stalling in its lower bound. Participants seem to await for the BoE Meeting to move their pieces further.
Today’s session marks another consecutive doji candle, so let’s take a closer look to spot more detailed levels.
GBPUSD 4H Chart
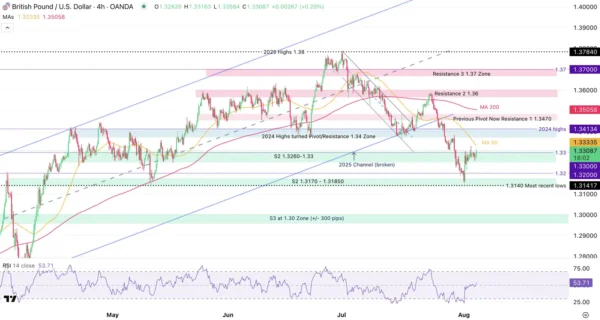
GBPUSD 4H Chart, August 5, 2025 – Source: TradingView
Buyers are trying to push the pair towards the 4H 50-period Moving Average but seem to find some lack of conviction at the 1.33 psychological level.
The support and resistance levels, drawn in our previous Bank of England June-meeting analysis have held very strongly (for now), with the pair finding some dip buyers at the previous S3 level (currently S2 – see the prices below).
Breaking the most recent lows point to a resumption of the bearish trend and this would see the Pound giving back more of its early 2025 gains.
In the meantime, look at the reactions to the 50-period MA (currently at 1.3328); any break higher will test the key 1.34 pivot, a major level for bull/bear strength.
Levels to watch for the pair:
Resistance Levels
4H MA 50 1.3328
2024 Highs turned Pivot/Resistance 1.34 Zone
Previous Pivot Now Resistance 1.3470
Main Resistance 2 1.36
Daily Support Levels
Support 1 1.3260-1.33
Support 2 1.3170 – 1.31850 – Most recent lows 1.3140
S3 at 1.30 Zone (+/- 300 pips)
A lack of conclusive price action does not warrant many reasons to look at smaller timeframes, with the pair stuck in a 500 pip range between 1.3260 (lows) to 1.33150 (highs).
Trade the pair with caution in the waiting of the rate decision.
Safe Trades!