
The US Dollar is beginning the week on a tough note as the White House appealed the Federal Court decision to block US tariffs – which has also dampened the risk-appetite on the week.
All majors are higher with the Asian-Pacific currencies leading the charge – NZD and JPY are both up above 0.80% against the USD in the morning session.
Gold is also much higher +2.40% on the day, with Bitcoin and Stock Indices down (though not by too much).
Let’s dive into a DXY Analysis starting from the Monthly timeframe.
US Dollar Monthly, Weekly and Daily Analysis
Monthly Chart
Dollar Index Monthly Chart, June 2, 2025. Source: TradingView
A weaker US Dollar is one of the technical themes moving forex markets.
The Index is still at a relatively high level especially when compared to the 2010 decade where the USD was still recovering from the damages done by the 2008 Financial Crisis and the QE that followed.
The 2010 decade low for the DXY was at 72.80!
For a reminder, Quantitative Easing is a policy to “print” money to buy government bonds or other assets. This helps lower interest rates and boost the economy when growth is slow – like after 2008.
We can see that the monthly MA 200 is closer to 91.50 – levels last seen in October 2021. Especially with the FED not having began its cut cycle, it’s too early to say the Dollar is already weak.
A zone to look out for in the upcoming weeks would be the lower key support at 95.50. We’ll see better on a weekly chart.
Weekly Chart
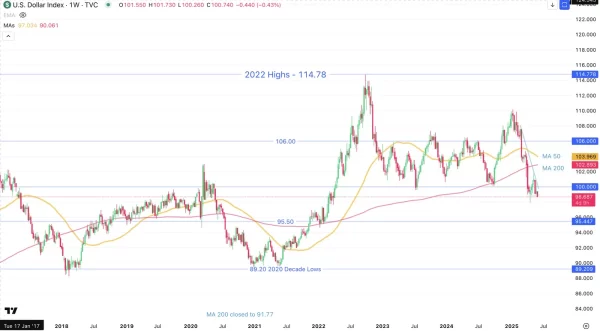
Dollar Index Weekly Chart, June 2, 2025. Source: TradingView
After hanging around here for the last two months, we spent most of last week below the 100.00 Psychological level, and Moving Averages are now all above current prices.
They will now act as resistance instead of support, though they may magnet the Index higher on retracements.
Prices were in a solid range—100.00 to 106.00—between 2022 to 2024, and a breakout to the upside at the end of last year was rejected, as prices have gone down sharply since the 110.00 highs in February 2025.
In the meantime, a deeper selloff in the Dollar index points at a new range forming between 95.50 and 100 – these prices are still far, though more uncertainty and tariffs may accelerate this.
Daily Chart
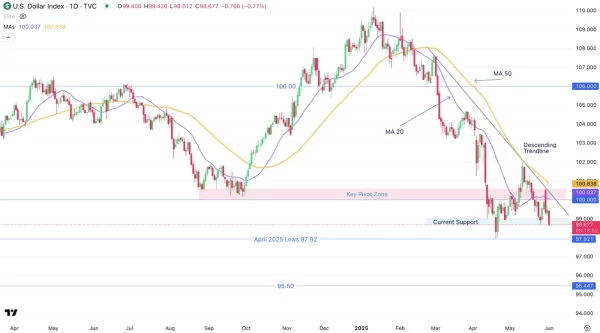
Dollar Index Daily Chart, June 2, 2025. Source: TradingView
We officially completed the U-turn from the September 2024 rise in the DXY to its ongoing fall.
There is a key pivot zone between 100.00 to 100.75 that was breached and is now acting as resistance as prices already bounced from there last week.
The descending trendline and MAs acting as resistances seem to be applying more pressure though as observed, the Daily MA 20 seems to be a candidate for retracements. It’s hanging around just above the 100.00 level.
We are currently trading in the immediate Support Zone between 98.50 to 99.00, a break trough here would point towards the April Lows at 97.20.
However, a rebound from here could point to a return to the key pivot zone and a consolidation of current prices.
Let’s see how to Trump Tariffs unfold as this will surely influence the appetite for the Dollar. Also don’t forget the key events of the week with the Bank of Canada and ECB in the middle of the week and May NFP on Friday.
Safe Trades!