Price: $3.99
(as of Jun 07, 2025 05:46:14 UTC – Details)
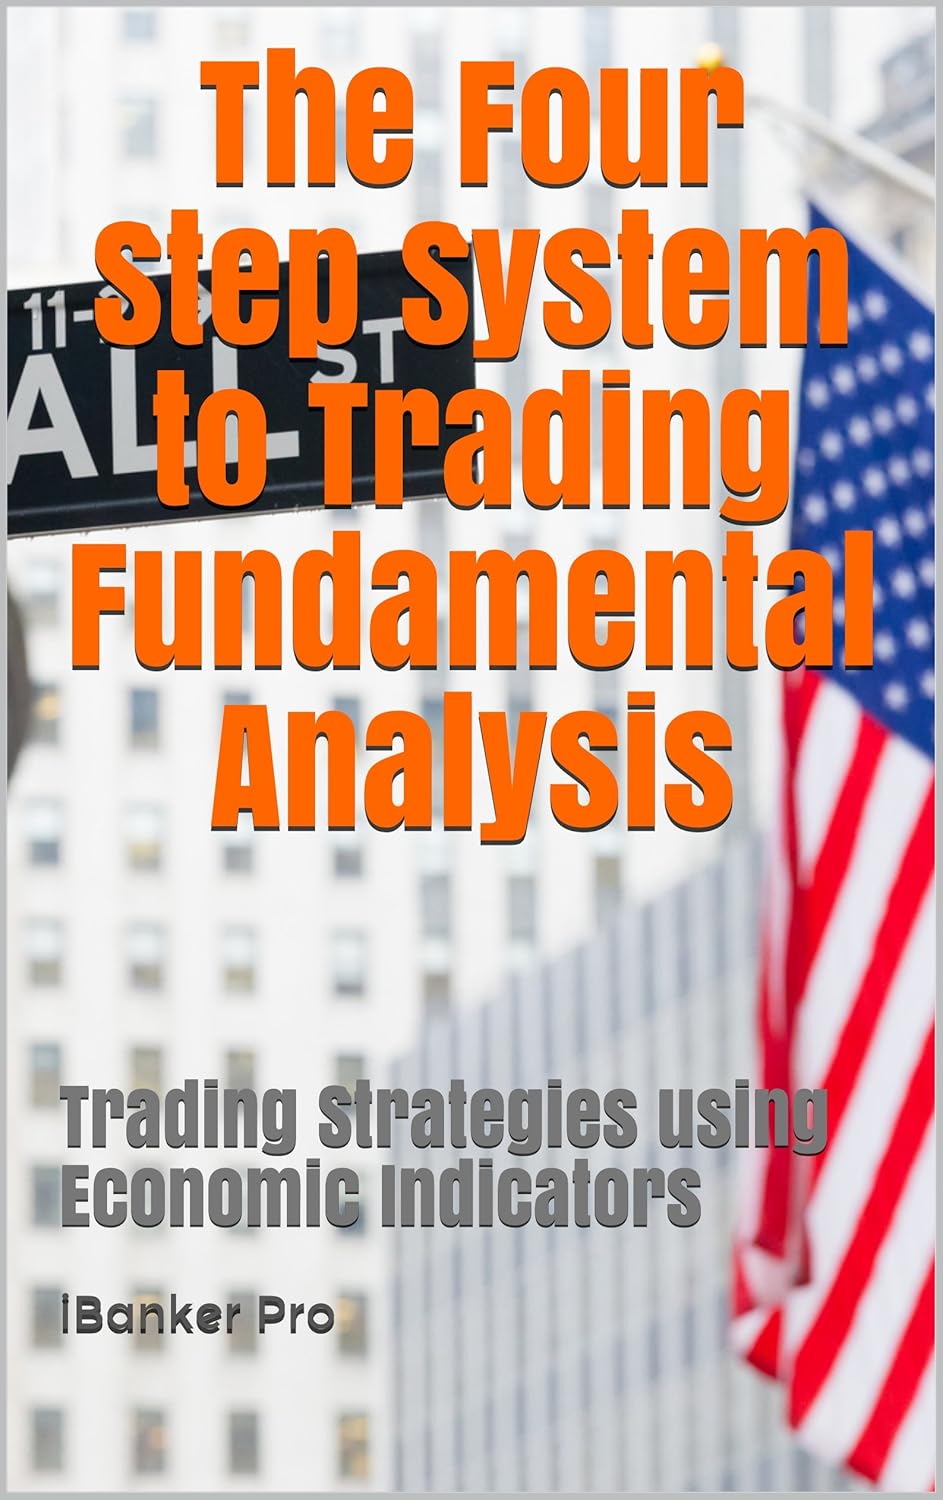
Fundamental analysis is the use of economic indicator releases to create trading strategies. Many traders rely purely on technical analysis to trade completely ignoring fundamental analysis. In addition, understanding economic indicators isn’t enough to trade financial markets. You need a system that you can use to generate profits from trading economic indicators
This book teaches you that system investment bankers use.
Do you know the #1 reason why many retail traders underperform compared to their market counterparts namely – interbank dealers, hedge funds, financial institutions?
Studies suggest that despite retail traders having strong requirements to be well informed they are not. They do not anticipate returns on trades, lack trading acumen and are emotional when trading.
What stops traders from being better informed, improving their trading acumen or reducing emotional trades such as hope and wishful thinking?
It’s not easy. To make the connections between economic indicators, financial instrument prices and the central bank’s reaction to these indicators is hard.
However, this book simplifies this task. There are just four steps that investment bankers follow to trade financial markets using economic indicators.
Many traders never really understand the “fundamentals” behind the primary trend or reversal of trends nor the linkages between economic indicators, financial markets, and central bank’s monetary policy.
The Four steps that we study in this book are –
Step 1 – Identify the price determinants of financial instruments
Step 2 – Understand how each economic indicator contributes to either economic growth or inflation (we use an economic map to demonstrate these connections)
Step 3 – Classify the impact of each economic indicator on financial instrument prices. We will create this in a spreadsheet using the knowledge gained from this book as well as inputs from online service providers
Step 4 – Create an impact analysis spreadsheet that will assist us in taking positions prior to and post an economic indicator release.
The Use of an Economic Map
We make these connections between economic entities, factors, markets and central bank policies through the use of a economic map . The economic map helps us to understand how each small sub-component aggregates to the larger components, which in turn aggregate to the Gross Domestic Product thus giving us a wider perspective of how entities interrelate with one another.
You could also sign up for the video course – Beginner to Advanced Trader – An Investment Banking Perspective by copy-pasting the link below in your browser
https://www.udemy.com/the-complete-forex-course-an-investment-banking-perspective/?couponCode=TRADEO-BK
“Market Analysis can be approached from either direction (Technicals or Fundamentals). While I believe that technical factors do lead the known fundamentals, I also believe that any important market move must be caused by underlying fundamental factors. Therefore, it simply makes sense for a technician to have some awareness of the fundamental condition of a market.” – John J. Murphy, Technical Analysis of the Futures Market
A sample of the economic indicators we will study are:
The Quarterly GDP Report
Car Sales Report
Retail Sales Report
Personal Income and Outlays Report
Housing Starts
Durable Goods Orders Report
Factory Orders and Manufacturing Inventories
Construction Spending
Trade Balance Report
Purchasing Manager’s Index
Employment
Industrial Production
Leading Economic Indicators
You can also visit https://www.investopediapro.com for more details
ASIN : B01HJ56V7O
Publisher : AltGmX Technology Pvt Ltd
Accessibility : Learn more
Publication date : June 24, 2016
Edition : 2nd
Language : English
File size : 8.4 MB
Simultaneous device usage : Unlimited
Enhanced typesetting : Not Enabled
X-Ray : Not Enabled
Word Wise : Not Enabled
Format : Print Replica
Page Flip : Not Enabled


Reviews
There are no reviews yet.